Looking at it out of isolated years shows a different picture.
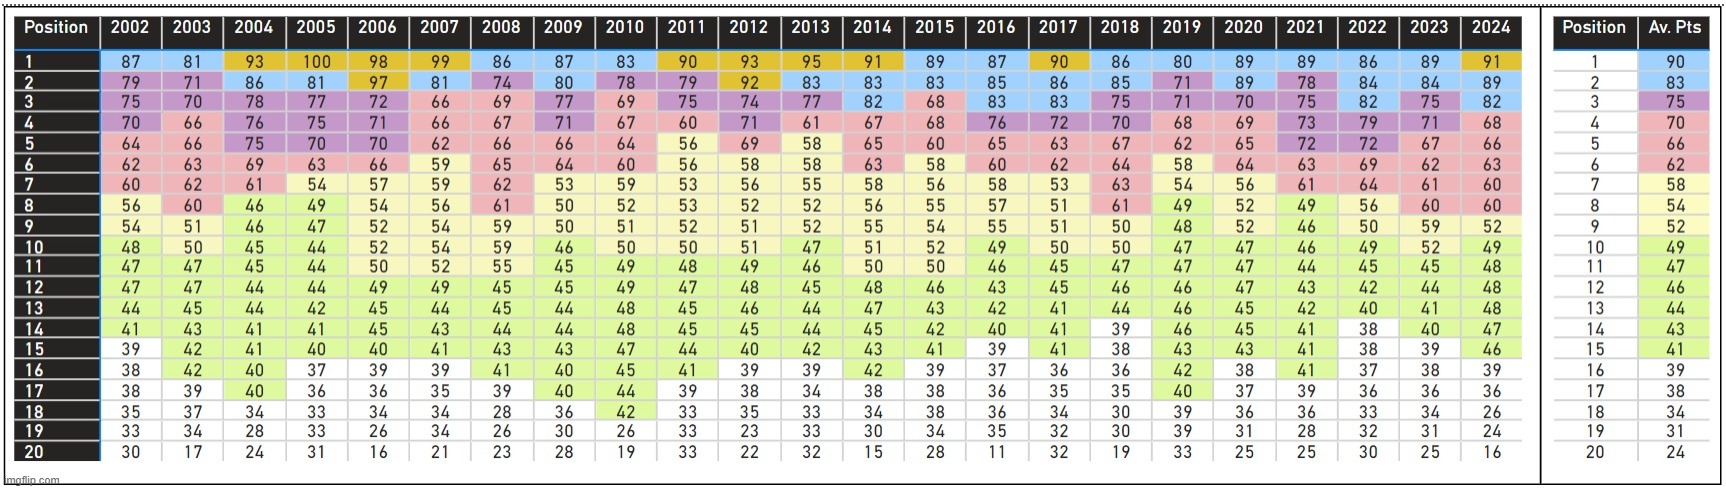
This season the bottom 3 have been awful, massively underperforming against the average points for those positions over the last 23 years[Thats as far back as my datasource<https://www.footballwebpages.co.uk/prem ... ague-table> went]. If you'd looked at the figures last year, then they'd have performed almost exactly to what the average performances were.
*I added ours and Forest's deducted points back in so that it shows points earned, not final points.
Goaljira wrote: ↑Wed May 22, 2024 8:52 am
Looking at it out of isolated years shows a different picture.
This season the bottom 3 have been awful, massively underperforming against the average points for those positions over the last 23 years[Thats as far back as my datasource<https://www.footballwebpages.co.uk/prem ... ague-table> went]. If you'd looked at the figures last year, then they'd have performed almost exactly to what the average performances were.
*I added ours and Forest's deducted points back in so that it shows points earned, not final points.
Nice one Goaljira, love a good spreadsheet.
Out of interest I took that data back to 95/96 (first EPL season with 20 teams) and totalled and then averaged the points for each of the following groupings and plotted with added linear trendlines.
Top 3
Positions 4-6
Middle 7-14
Positions 15-17
Relegation
The data suggests that it doesn’t really matter how many groups its cut into, 4, 5 or 6 groupings, that it does seem that the league is becoming more disparate with time. Whilst there are differences in the short term with ups and downs from season to season, there is a long term trend that shows the strong are getting stronger (Average 10pt increase for the top 3 teams, based upon averaged trend, since the inception of the EPL) and the weak are getting weaker (average -7pts for the relegated 3 teams). Obviously there are limits of 0 and 114pts, not sure we’re getting that close to these any time soon.
Cods wrote: ↑Wed May 22, 2024 2:26 pm
Nice one Goaljira, love a good spreadsheet.
Out of interest I took that data back to 95/96 (first EPL season with 20 teams) and totalled and then averaged the points for each of the following groupings and plotted with added linear trendlines.
Top 3
Positions 4-6
Middle 7-14
Positions 15-17
Relegation
The data suggests that it doesn’t really matter how many groups its cut into, 4, 5 or 6 groupings, that it does seem that the league is becoming more disparate with time. Whilst there are differences in the short term with ups and downs from season to season, there is a long term trend that shows the strong are getting stronger (Average 10pt increase for the top 3 teams, based upon averaged trend, since the inception of the EPL) and the weak are getting weaker (average -7pts for the relegated 3 teams). Obviously there are limits of 0 and 114pts, not sure we’re getting that close to these any time soon.
EPL points.png
I think the Top 3 is too narrow a focus. I think its the second and third groups in your charts thats the issue. Whereas before you had the Top 3 of United, Arsenal, Liverpool and a rotating 4th place that wasn't CL. Then you had Chelsea expand it to 4th with Abramovich. Then City, and Spurs hanging around made it a 6. Now Newcastle have made it a 7, with Villa and Brighton both having decent recent seasons effectively pushing it to an 8 albeit on a floating basis. The more better teams you've got, the less points the worser teams will get.